P/02 · Back to projects
NatWest Group
Insights Engine
Turning engineers into the customer — optimising a software engineering department by redesigning the employee experience.

Client
NatWest Group
Method
Service design
Discipline
Product & platform
Sector
Banking
01 — Background
An engine of insights into the developer experience.
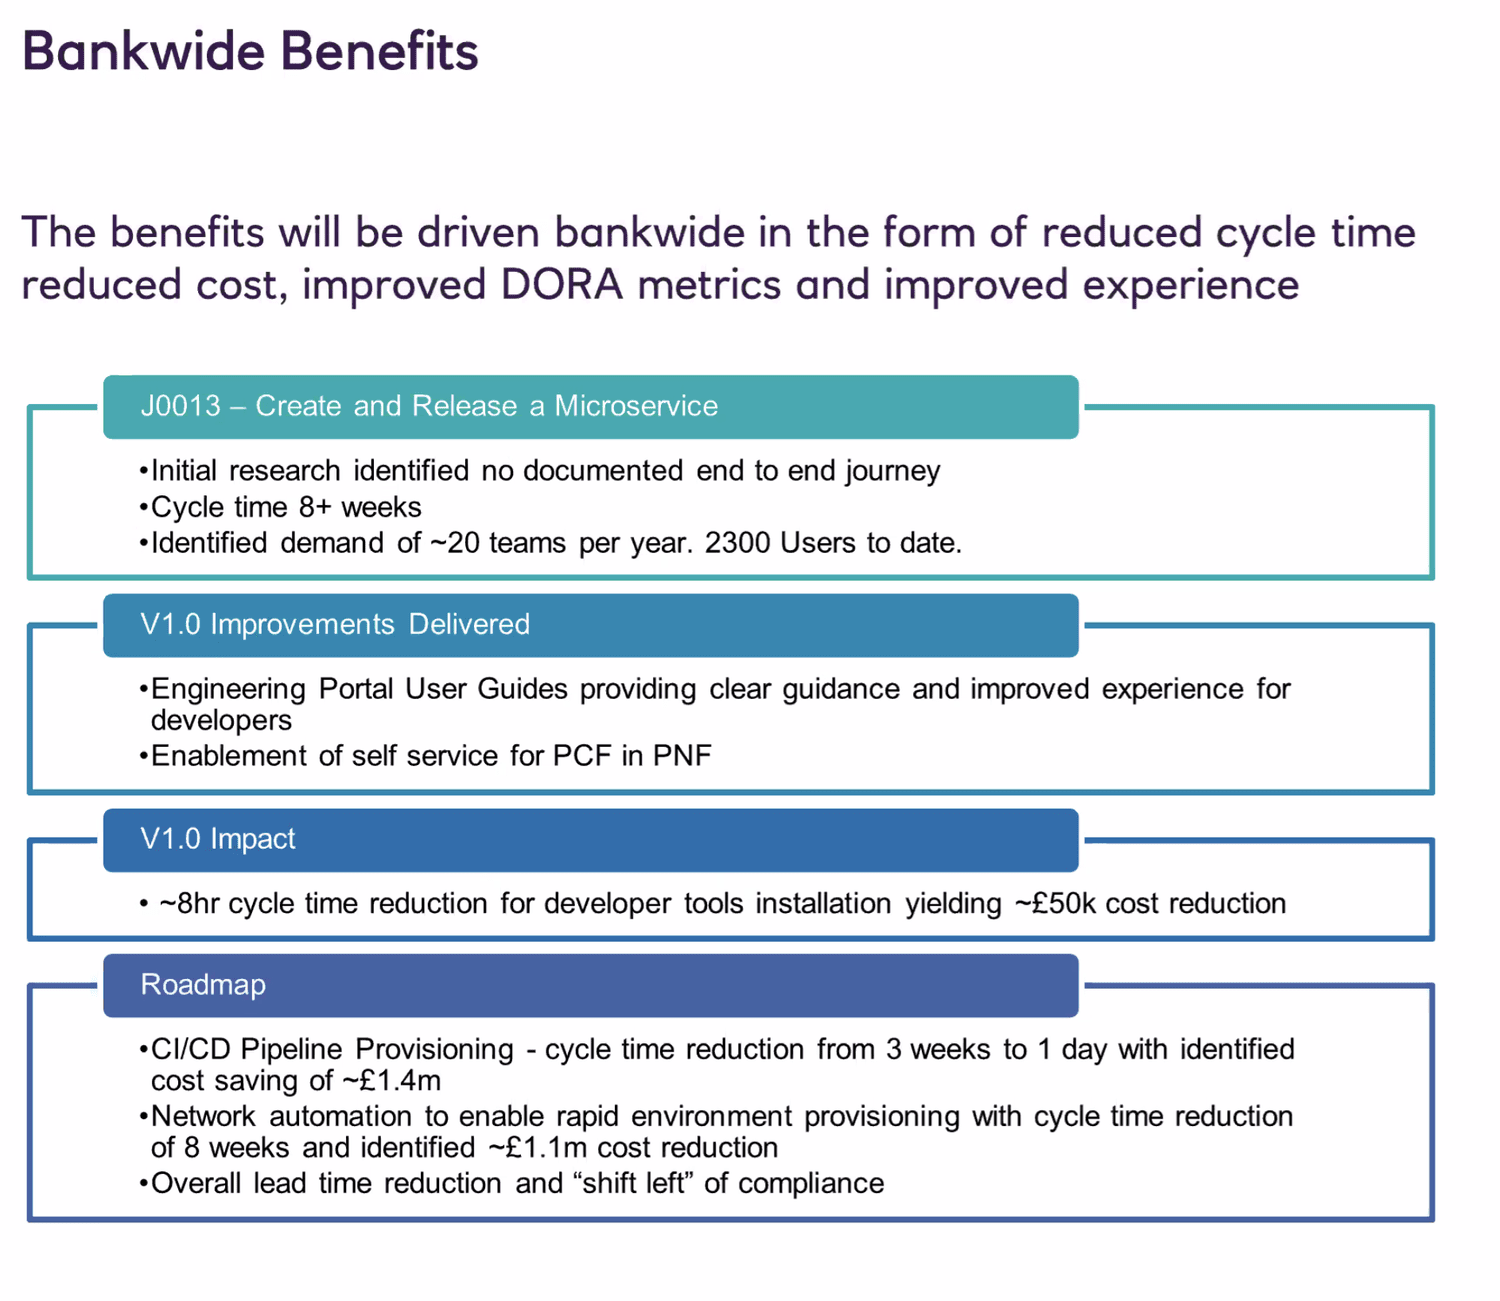
NatWest Group wanted to optimise their software engineering department and improve the employee experience for a substantial community of developers spread across many projects.
Management believed that a robust engine of insights could gather comprehensive data on the employee experience, and that this data could then be used to improve it. The hypotheses were straightforward: a better work environment would raise efficiency, strengthen retention, and contribute to the overall success of the bank.
Having been introduced to service design, they wanted to explore whether it could work as the methodology to carry that ambition forward.
02 — The shift
We treated the engineers as the customer.
03 — Problem
Frustration was costing the bank knowledge.
NatWest's software engineers were dealing with a disordered employee experience, and the resulting frustration was pushing people to leave.
Every departure set projects back and drained knowledge from the community. Weak practices created delays through dependency bottlenecks, and research and insight moved poorly between teams that needed it.
The consequences landed on the things the department was measured by: time-to-market, team morale and staff retention all suffered for the affected teams.
04 — Solution
Customer journeys turned into data-driven service blueprints.
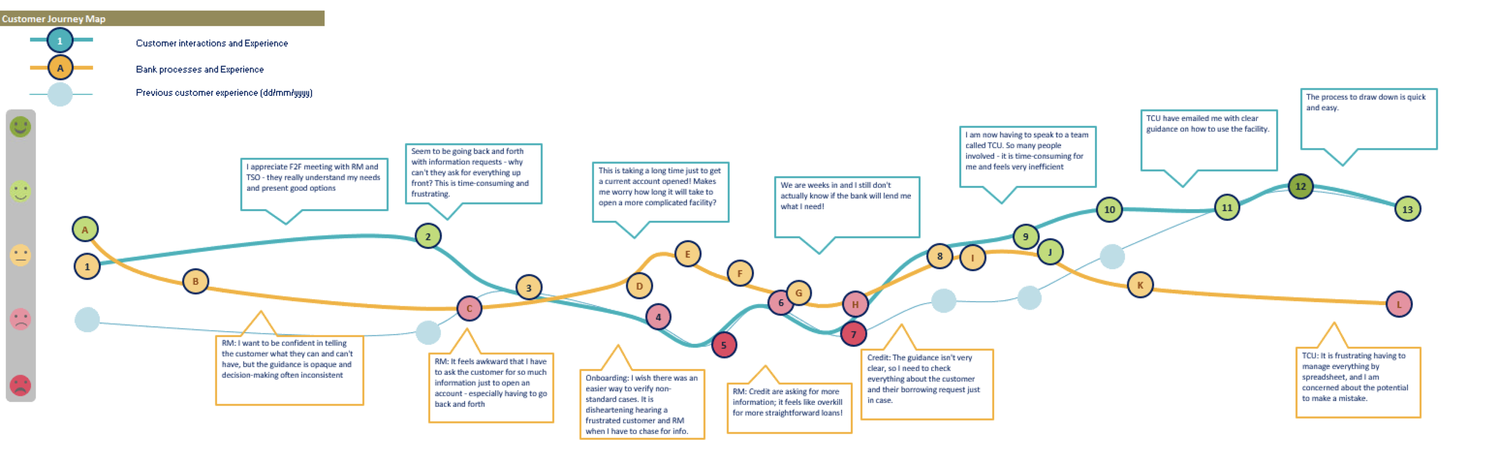
Taking the engineers as our primary customers, we explored their experience across the whole of their working life at the bank — onboarding, running bespoke projects, day-to-day operations, and the process of leaving the organisation.
Those customer journeys were systematically turned into data-driven models and placed at the front of the service blueprints. The blueprints worked as alignment frameworks, showing how the activities of every team across the organisation connected to each other.
They captured both the visible, customer-facing actions and the backstage processes behind them. Examining the two together is what surfaced the pain points, and the opportunities to improve the contextual encounters that happen at every major and minor juncture of the job.
Journeys mapped
05 — Living documents
Blueprints that keep working after the project ends.
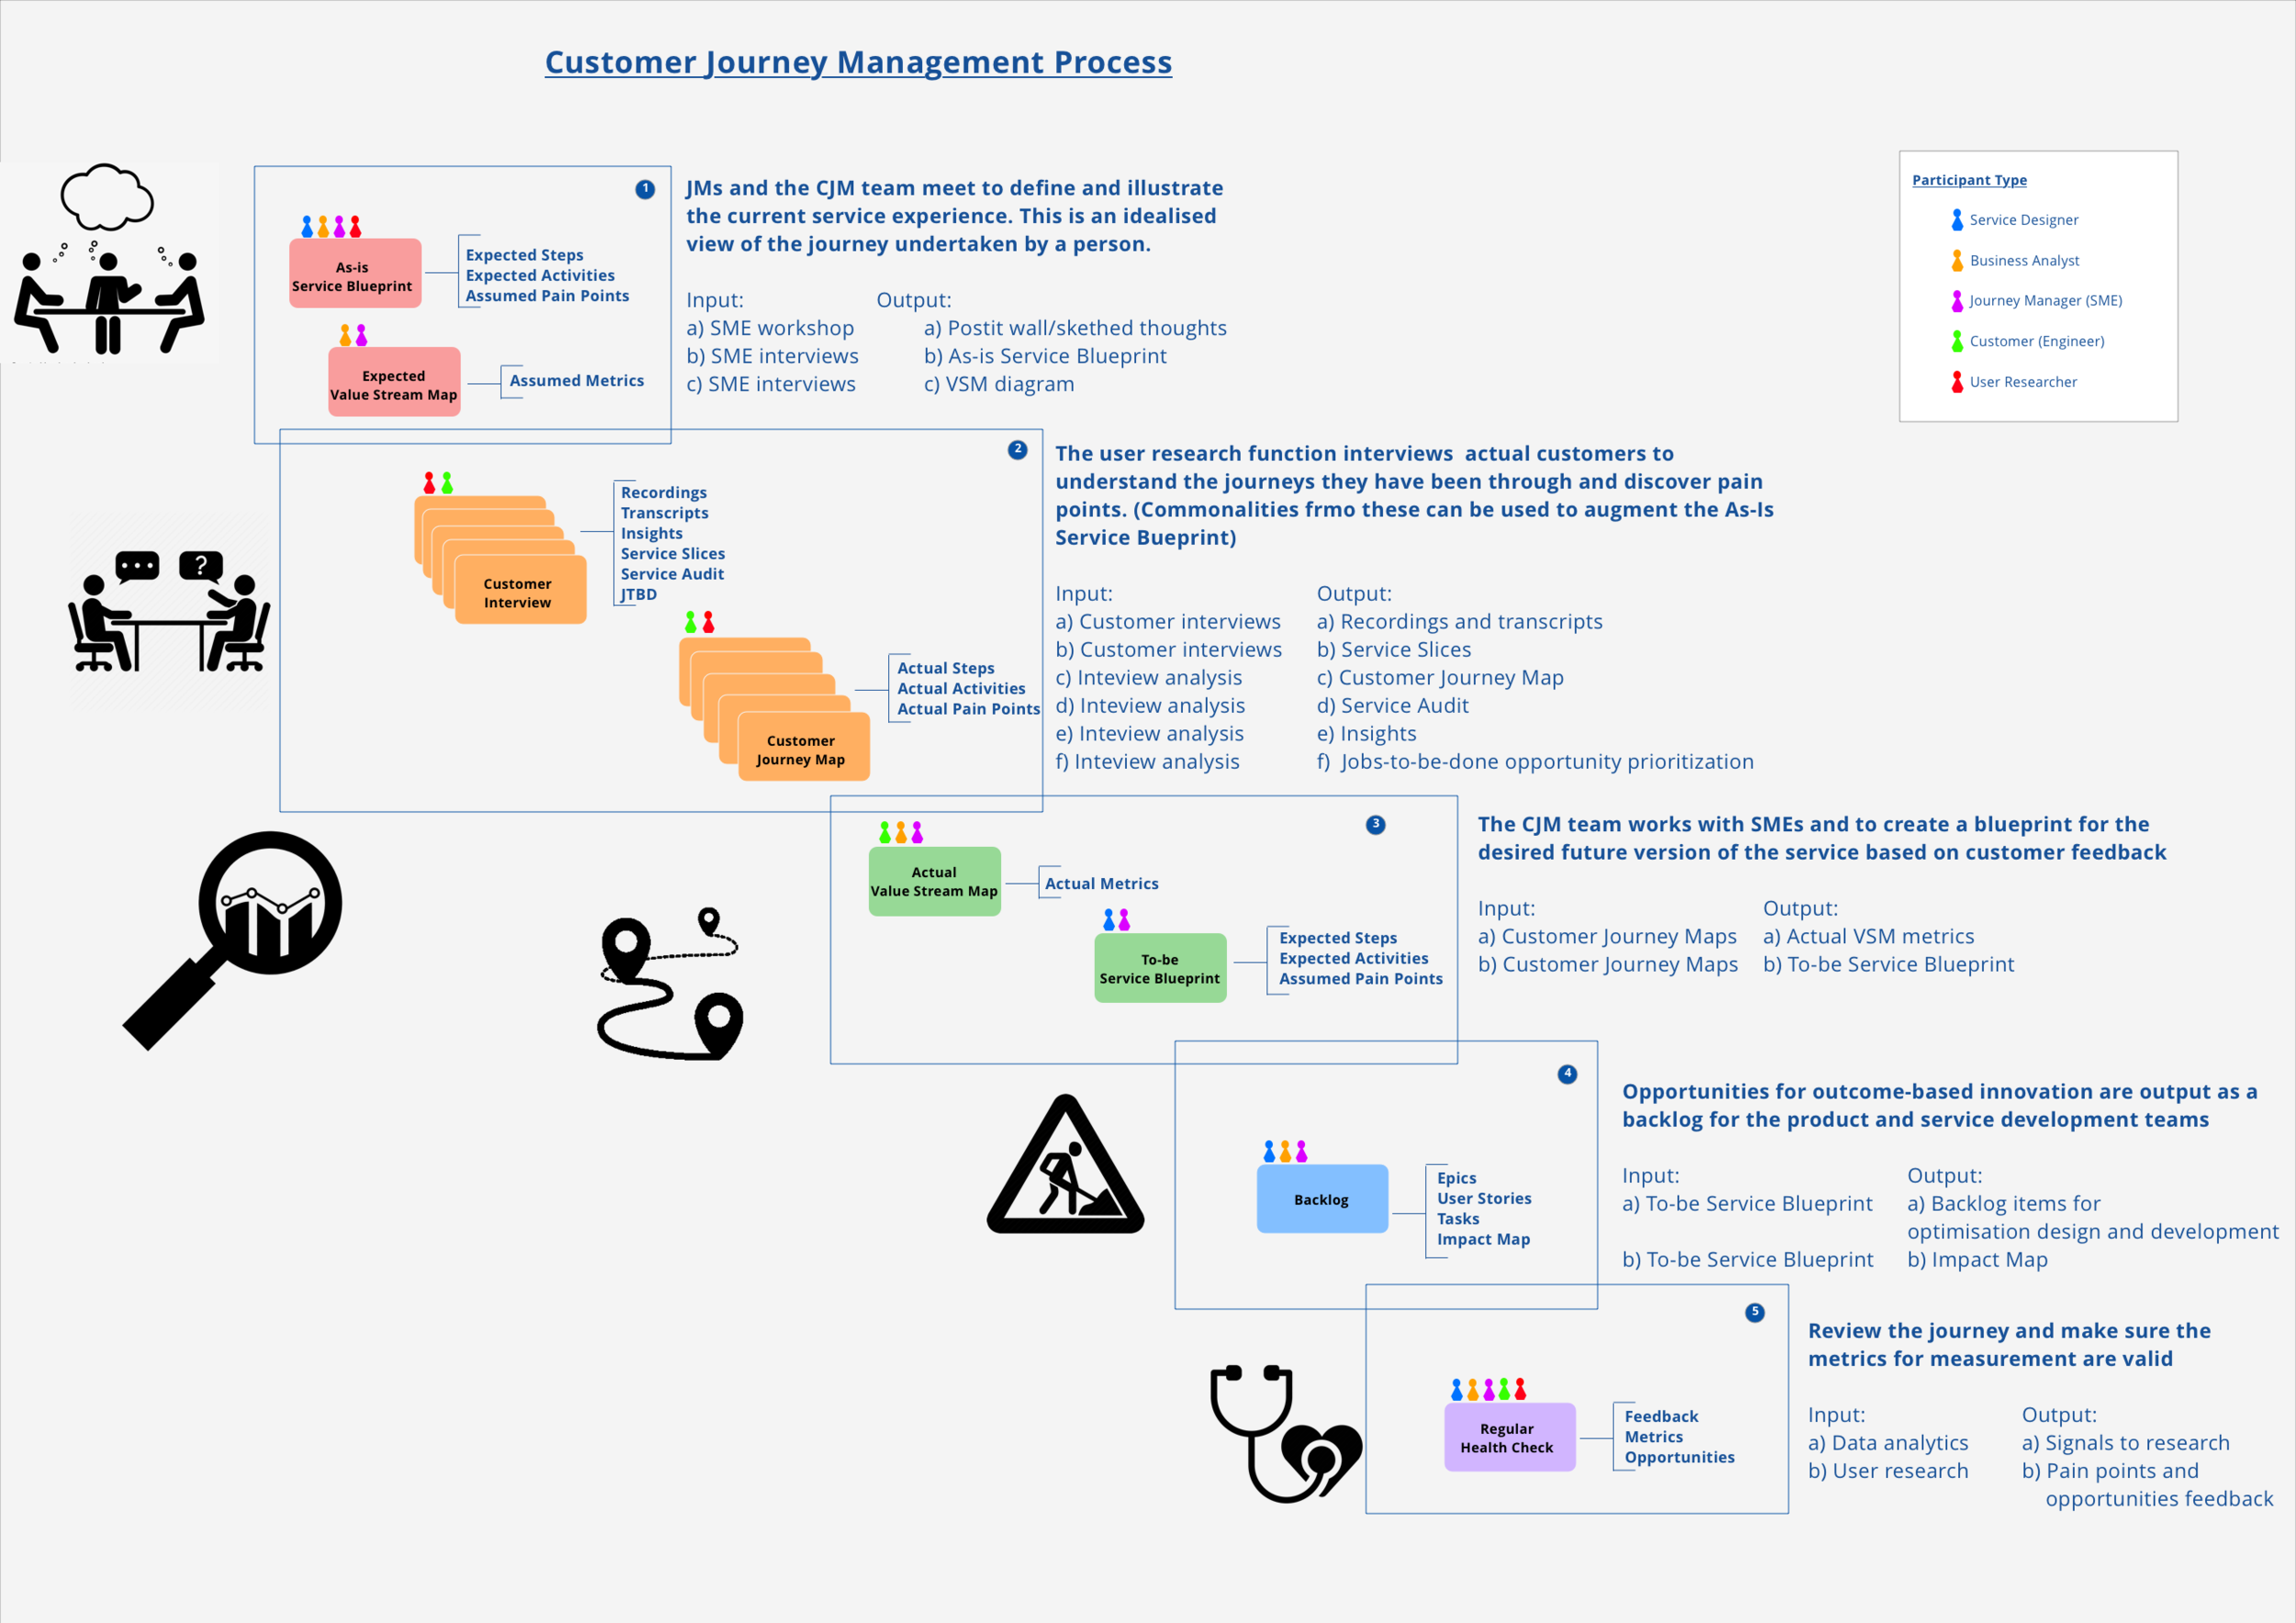
In the digital realm the blueprints behaved as living documents, receptive to both qualitative and quantitative information.
That let insight accumulate over time around areas of concern and potential risk. The blueprints then served two purposes at once: repositories of Management Information for evaluating historical performance, and sources of Business Intelligence for planning a more enriching future.
Management Information
Evaluating how the department has actually performed, on evidence rather than impression.
Business Intelligence
Strategic planning for what the engineering experience should become next.
06 — Impact
A common language for issues, risks and improvement.
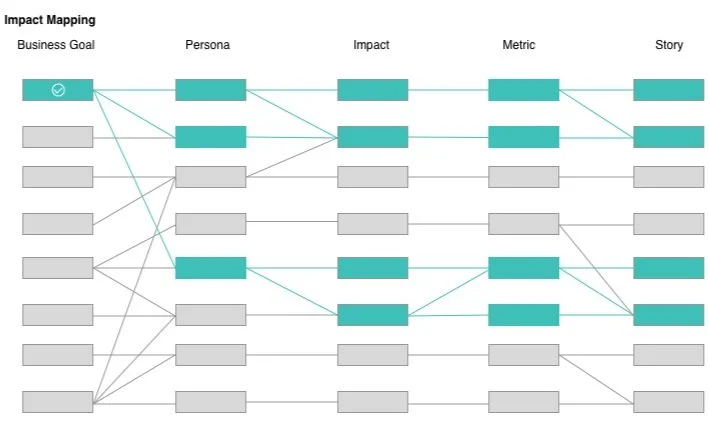
Impact mapping frameworks were built to plan for and assess the hypothetical benefits of any change before committing to it.
Each table carried a clear provenance: from goal, to the people affected, to the impact planned, to the metrics that would measure it, to the change actually delivered. Nothing arrived without a stated reason.
They proved popular with staff and management alike, because both could see the vision and the strategic route to their goals in the same place — and could finally talk about issues, risks and improvements in one shared language.
Provenance chain
Contact